Why Bitcoin Google Searches Stay Low Despite New ATH?
Key Insights:
- U.S. Google searches for Bitcoin remain low despite new highs.
- Realized cap growth shows Bitcoin needs more capital per surge.
- Analysts highlight weak retail interest in the current BTC rally.
Bitcoin set a new all-time high today, rising to $109,486 during the early U.S. session on Wednesday. This move surpasses the previous peak of $108,268 recorded in January around Donald Trump’s inauguration.
Prices have risen by more than 46% since April. Concerns over global trade tensions and U.S. tariffs drive this increase. Despite the sharp movement, search interest in the U.S. remains low. It is still well below historical levels.
Google Search Activity Diverges From Bitcoin Price Trend
While BTC prices ascend into uncharted territory, online search activity in the U.S. does not follow the same path. Bitcoin’s current search interest on Google Trends is 30.
This is significantly lower than the 75 level recorded in late 2024. The previous high was reached when Bitcoin neared its record price. At that time, elevated search volumes suggested strong public attention and widespread retail engagement.
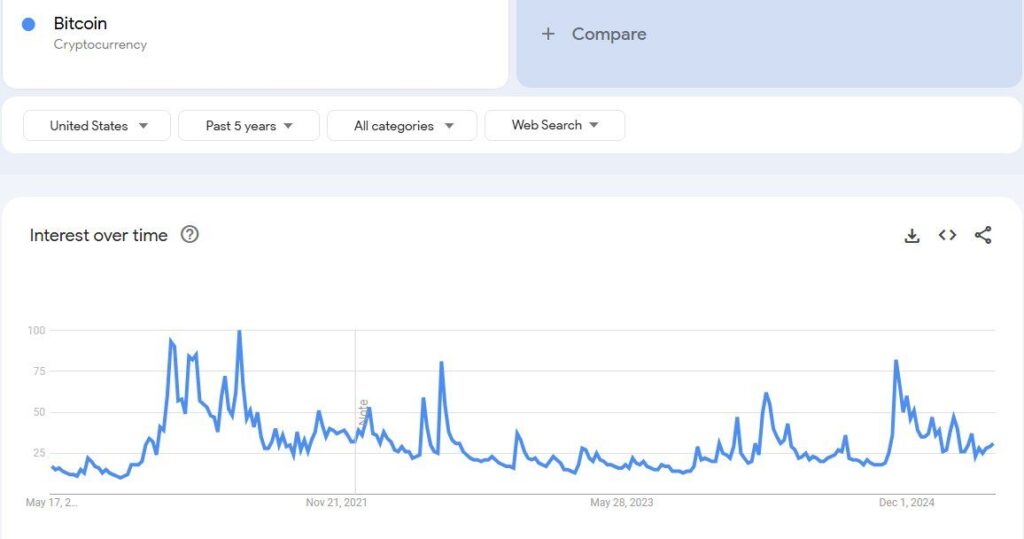
Sigel’s analysis, based on five years of Google Trends data, highlights a notable decoupling between price and public curiosity. During past rallies, search spikes often coincided with new highs.
In contrast, today’s rally unfolds with far less visible retail interest. Despite Bitcoin trading above its January peak, search behavior indicates muted engagement from casual or first-time participants.
Some online communities have speculated that learning patterns may shift toward platforms like ChatGPT or Grok. However, Sigel emphasized that Google Trends measures relative search frequency across the web, not absolute learning interest.
The decline in search activity isn’t just because users are moving to new platforms. It also reflects a larger trend affecting overall search behavior.
Market Analysts Note Changing Sentiment
Independent analyst CryptoCon pointed to recent sentiment shifts in response to the market conditions. He noted that many investors exited their positions earlier this year. Warnings of a potential bear market or economic downturn influenced their decision.
Many narratives predicted a recession or market crash. However, Bitcoin kept rising instead. CryptoCon explained that these widely circulated fears prompted many holders to reduce exposure near cycle lows.
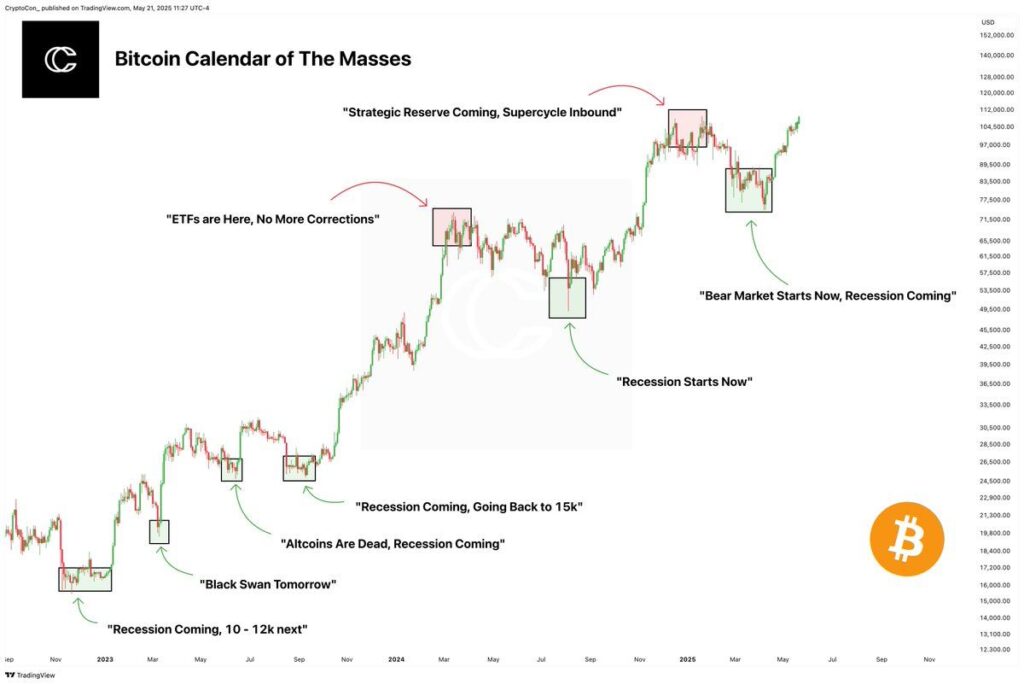
As a result, they may have missed out on the subsequent rally to new highs. He indicated that historical market patterns have held up once again, referencing previous cycles that began under similar circumstances.
He didn’t provide exact price predictions. Instead, he pointed out that public perception has been slow to catch up with recent data trends.
This contrast between sentiment and performance underscores a broader disconnect between traditional market psychology and ongoing price action. As narratives shift from bearish to bullish, past assumptions about the market’s direction may have limited predictive power.
Glassnode Identifies Slower Growth in Capital Inflows
Bitcoin prices are rising, but Glassnode reports that its long-term capital inflow is slowing. The firm’s “Logarithmic Milestones (Realized Cap)” chart shows this trend.
Over the years, BTC’s realized capitalization has grown at a decreasing rate. This suggests that new capital entering Bitcoin is slowing down over time.
The realized cap calculates the value of each coin at its last on-chain transaction price, offering a view into actual invested capital.

Between early 2011 and February 2013, Bitcoin’s realized cap skyrocketed from $1 Million to $1 Billion. This rapid surge reflected the cryptocurrency’s explosive growth during its early adoption phase.
By November 2013, it had reached $10 Billion. However, it took until May 2017 to hit $100 Billion, marking a shift to slower accumulation.
According to Glassnode’s 2025 data, the metric now approaches the $1 Trillion milestone. Notably, the time taken to progress from $100 Billion to $1 Trillion has stretched to nearly six years. This deceleration tells us it needs much more capital to reach each successive milestone.
The flattening of the curve on the chart highlights Bitcoin’s transition from a speculative asset to a more stable one. This shift has been marked by steadier inflows, reflecting its growing maturity.
Disclaimer
This article is for informational purposes only and provides no financial, investment, or other advice. The author or any people mentioned in this article are not responsible for any financial loss that may occur from investing in or trading. Please do your research before making any financial decisions.